 Pixel Trichy
Open the map →
The making of
How we made Pixel Trichy, an isometric pixel-art map of Tiruchirappalli
Pixel Trichy is a city you can zoom into: Rockfort and its temple steps, the gopurams of Srirangam, the sandbanks of the Kaveri and Kollidam, the railway yards at Golden Rock, the fields around Manachanallur and the old dams at Kallanai and Mukkombu. Every building on it comes from open data, and every tile was painted by an AI model that we steered, checked and corrected. This is how it was put together.
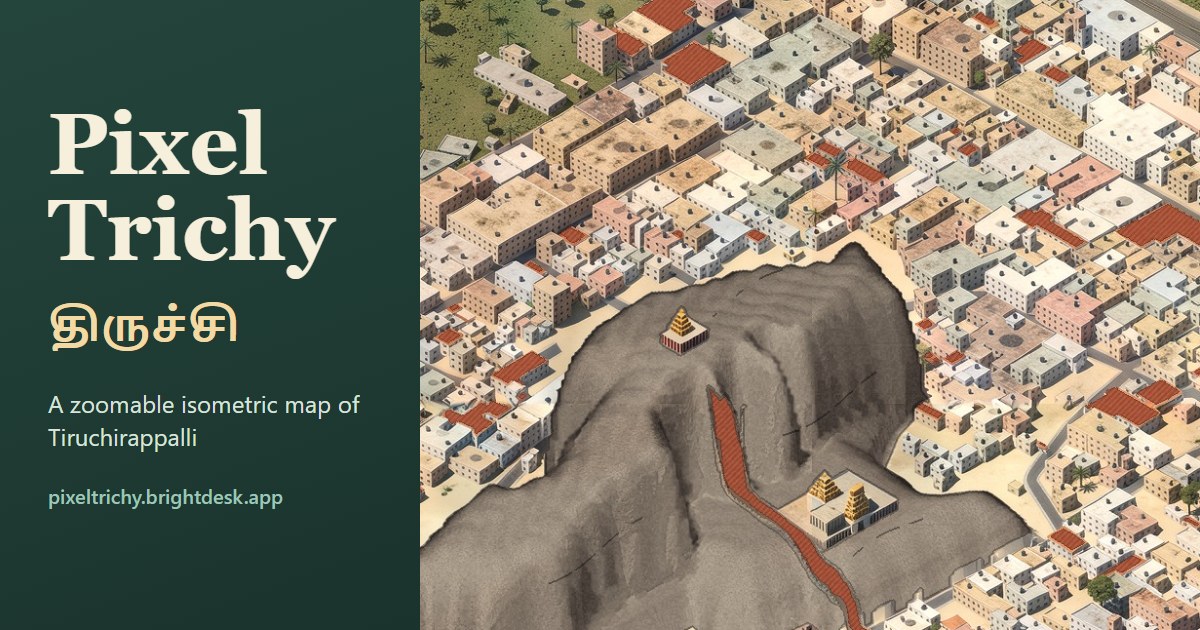
1. Start from open data, not imagery
The map is not traced from satellite photos. It is rebuilt from open datasets, so every road, building and river is where the data says it is:
- OpenStreetMap for roads, railways, rivers, canals, tanks, temples, parks and place names, in English and Tamil.
- Overture Maps building footprints, and Google Open Buildings 2.5D plus the GHSL built-up layer for how tall each building is.
- ESA WorldCover for farmland, scrub, trees and bare ground, and Meta/WRI canopy heights for trees.
- Copernicus GLO-30 elevation for the hills: Rockfort, and the rock at Ponmalai.
2. Build the city in 3D blocks
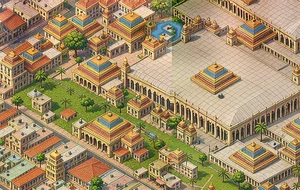
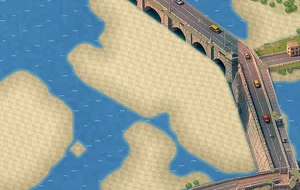
A renderer written in Python turns that data into a plain isometric scene, one 1024-pixel tile at a time, all seen from the same camera. Buildings are extruded to their height with windows and rooftop water tanks, temples get stepped gopurams sized to their footprint, rivers become sand and water, and roads that cross a river or another road are lifted onto bridges and flyovers at the height OpenStreetMap gives them. The whole city is 2,674 tiles on a canvas of about 84,000 by 37,000 pixels.
3. Paint it with an AI model, tile by tile
The block render is then painted in the map's illustrated style by FLUX.2 [klein] 4B, a compact open image model, with a LoRA (a small add-on that teaches it a style). The painter never sees the whole city at once: it works on 512-pixel blocks inside a 1024-pixel window, in four passes, and each new block is painted next to its already-finished neighbours so roads, fields and colours carry across the seams. The model runs on a single desktop graphics card.
Painting alone is not enough. A few procedural fix-ups repaint what an AI tends to get wrong: real river shorelines and sandbanks, bare granite on Rockfort, railway tracks, field patterns from land cover, and a colour pass that evens out the tone between neighbouring blocks.
4. A map you can explore, not a picture
The finished tiles become a deep-zoom pyramid in AVIF, opened in the browser with OpenSeadragon. Each tile's address carries a short content hash, so it can be cached for a year and still update instantly when a part of the map is repainted. On top of the art run a few live layers:
- traffic that follows OpenStreetMap lanes, including over the flyovers and river bridges,
- trains on the real railway lines, and aircraft at the airport,
- street lights at dusk, farm animals in the fields, and the current weather in Trichy from Open-Meteo,
- place cards and search in English and தமிழ்.
5. What came next
The map keeps changing. Canals and streams that OpenStreetMap only draws as lines now show as water, bridges sit at their real heights, and the hill at Ponmalai (Golden Rock) was added from elevation data. We are also training a new painting style on the same pipeline. If you see something wrong, open the map, click the spot and use Report spot.
Who made this
Pixel Trichy is a side project by the team behind BrightDesk, the booking, client and invoicing workspace for wedding professionals: makeup artists, photographers, decorators and planners. This map is our love letter to Trichy.
Credits
Map data © OpenStreetMap contributors. Pixel Trichy is built on the open-source Pixel Coimbatore pipeline, inspired by isometric city maps such as isometric.nyc. The full list of datasets and licences is on the credits page.